Warehouse Design – Modelling and K. Sight CLASS Simulation (Part 1 of 2)
Posted on 18th July 2022
The CLASS software being in development for over 25 years, and I personally have been a user for over 20 years. The software is used to create 2D and 3D warehouse layouts and to simulate warehouse operations. The software is used by most of the major 3rd Party Logistics providers and many major retailers and in-house logistics operations all over the world.
Users of CLASS attend a 3-day training course which covers the core skills required to complete detailed warehouse layouts and execute simulations. There are additional courses for more advanced and special areas such as site traffic modelling, (this extends the warehouse simulation to include all vehicles movements into / around and when exiting the site, this can identify potential bottlenecks through
the gate house
or parking areas
capacity of the shunters.
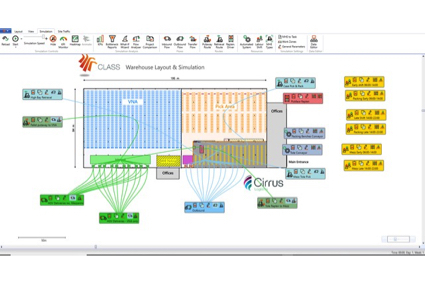
Warehouse Layout including Site Traffic Routes and Processing areas
The CLASS simulation software is relatively quick to learn. The users will need to have a basic understanding of warehouse operations, equipment, and processes in order to understand the outputs from the simulation and to make logical changes and to understand the results generated. The software is now on version 16 and users familiar with Windows applications will find it easy to use.
Simulation Stage 1 – Creating the Physical Warehouse
The process starts with the user creating the physical warehouse using a 2D scaled layout.
Note: if an AutoCAD drawing of the site is available this can be imported to CLASS as an image, which can scaled to the exact dimensions of the warehouse.
The CLASS layout system has objects created on layers. The key dimensions of the warehouse can be specified within the CLASS layout. These may include wall dimensions, dock sizes, racks sizes, aisle widths. The relative X Y coordinates of items from a known datum point can be specified, e.g. the racks could start at 4 metres from a known point.
Design objects can be positioned in the layout to the exact position required.
The design objects include:
Building walls
Docks / doors
Marshalling areas
Racks / shelving units
Mezzanine Floors.
At the time of creating the design objects various details, such as rack heights, number of levels, dock door heights, wall heights the dimensions can be specified on screen, by means of setting a Y value. By setting the height of various items the warehouse can be viewed in 3D.
Note: X, Y and Z coordinates are used in drawing software, X = horizontal axis, Y = vertical axis, and Z = 3d height.
The software can generate 2D elevation drawings of racks including dimensions. The dimensions can be set in metric or imperial. Front / Side Elevations can be generated showing dimensions as required. Warehouse layouts can also be generated in CAD format if required.
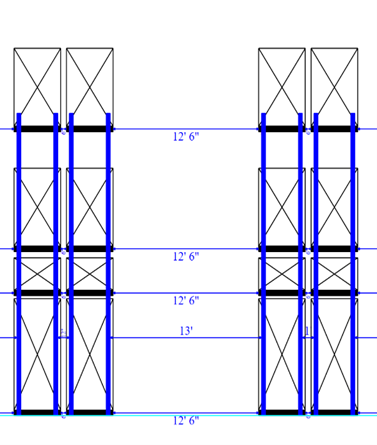
Rack Elevation
Once the warehouse design has been created the warehouse can be viewed in 3D, various screen shots can be captured and fly through videos can be created.
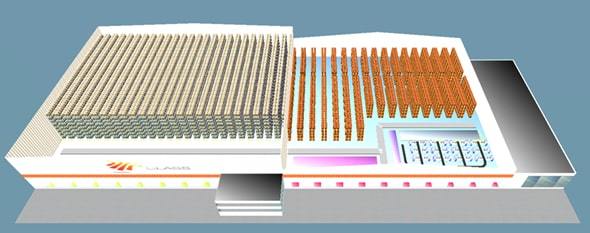
3D Image of Warehouse
Simulation Stage 2 – Setting the Operating Volumes and variables
Following the creation of the warehouse the volumes to be processed through the warehouse need to entered. The software is designed to simulate an operation over a 7-day cycle.
The key data generated through the Data Analysis process will be used to drive the simulation. In the previous section we discussed creating 4 sets of data, generally the “current average” week is used to test and validate the simulation model. This model is considered to be the Base Case model, the initial results from the simulation can then be compared with current operations. The base model can then be calibrated at a later stage if required.
The data required to populate the simulation is summarised as follows:
Inbound data – number of trucks, grouped logically – to include the number or pallets / items per vehicle load. The historic or forecasted arrival times are also assigned to the loads.
Outbound data – number of trucks set to leave – size of the load – the number of orders shipped, number of pallets picked and from which locations in the warehouse.
Additional information is required to support the picking activities in the warehouse, to include the average number of lines per order and number of units picked per order. To drive the simulation the process time for the picking operations is input, e.g. 10 seconds per line allowance for scanning / item verification and 5 seconds per item to pick.
Additional information is required to allow for replenishment, to include average travel distances and consolidation of stock at pick face time allowance.
Finally, to allow the simulation to run the number of warehouse operators, the hours worked, the areas they are assigned to and the duties they perform are entered.
The simulation also requires MHE with the appropriate truck types and numbers entered. The truck operating speeds can be set (note: the software has accurate real-life speeds for the most common trucks pre-set). The simulation will allow for lifting times, acceleration, and declaration times – and will also account for delays due to factors such as congestion in aisles.
In addition to warehouse trucks, the simulation can also include conveyors, AGVs, Automated Storage and Retrieval Systems, Miniload systems, Robotic forklifts, the Amazon / Kiva-type Goods to person picking systems.
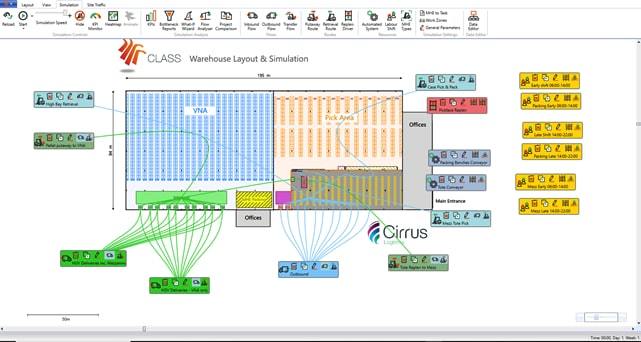
Complete Model – ready to execute the simulation
At this point the operation can be simulated. The image shows the various simulation objects summarised below:
Inbound Flows in green, put away routes and picking routes set.
Outbound Flows in Blue.
Labour Teams and shifts in Yellow.
Simulation
The final stage in the process is to execute the simulation. The simulation can be viewed on the screen and progress through the 7-day cycle checked on the on-screen timer. Any bottlenecks can be instantly viewed as the simulation progresses through the week, such as congestion on docks.
Upon completion of the simulation a suite of reports can be obtained which shows the various status of tasks.
Key Simulation outputs / Reports.
Dock utilisation
MHE utilisation
Labour Utilisation
Task Completion – orders picked
KPI reports – task rates generated by the simulation for tasks such as picking
Order completion times against targets.
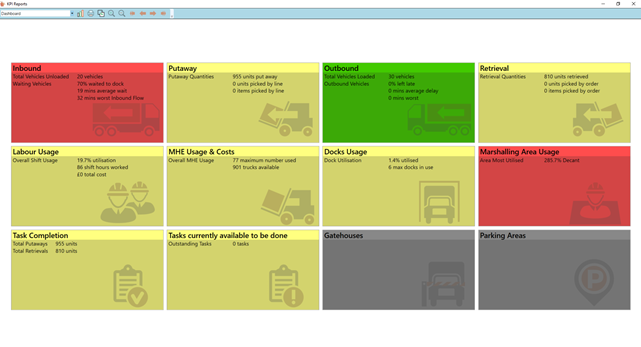
KPI Dashboard
Modifying the simulation
During the data population stage, it was stated that a base model should be created using the “current average” week volumes. This model can be calibrated, and the operator performance can be adjusted, or other adjustments made so the base model reflects the real life - actual operation.
The simulation can now be modified to allow for other “what if” types of modelling:
what if the volumes increase by 20% - (there is a quick uplift function that allows for these types of quick analysis)?
What if the truck types are changed for certain tasks?
What if we changed the shift start times, the number of operators on each shift?
The layout and operation could be changed to introduce some form of automation and the simulation run again.
Each time parameters are changed the results in the dashboard will change.
Simulation – Next Steps
At this stage, the simulation process is complete. Various concepts and layouts can now be compared. The current and future average and peaks runs can be simulated and the results analysed, any potential bottlenecks or operational problems can be identified in advance of the problems occurring in real life.
It is possible to evaluate manual operations against automated options. The data extracted can then be used to populate cost models if tendering for business, (especially suitable for 3PL’s), or used in Return on Investment models to justify any investment in layout, system, process or automation.
Peak operational resource requirements can be scheduled in advance, short term hire equipment can be ordered and labour recruited and trained in advance of peak periods.
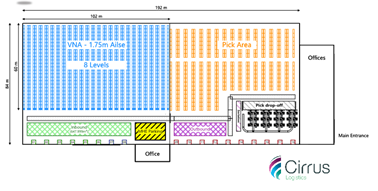
Case Study
3D image showing the Demo warehouse
Whilst working at Cirrus as a Consultant I conducted an evaluation of alternative storage concepts. CLASS comes pre-installed with a demo project; this is a fully functioning made up warehouse of a 7-day operation. There is a VNA reserve bulk storage (on the left of the image), Wide Aisle picking area and a mezzanine shelving area and a conveyor system. The VNA racks are used as a bulk storage area for full pallets, the pallets are then either sent to the despatch area for shipment, or sent to replenish pick pallets in the wide aisle section of rack (on the right in the image). The wide aisle area is a case picking area and the pallets from VNA replenish the pick faces.
The VNA area has a total of 19,200 pallet spaces, and it is assumed that for planning purposes the maximum occupancy of the area assuming 95% utilisation is 18,240. The purpose of the exercise was to compare how different rack types would impact on the storage space required, and the labour and MHE required to meet the same operating volumes.
The base Demo model was modified to show a total of 8 different rack types, each rack type had a different utilisation factor applied (utilisation factors were discussed in detail in the Warehouse racking Blog – these are variable based upon stock holding and storage profiles).
Sensible assumptions were made about the height and number of storage levels for each rack type based upon the MHE used to access the racks. Block stacks were considered to be a maximum of 4 levels, the VNA area 8 levels, the Wide Aisles 6 levels. For each rack type the appropriate aisle width was applied based on the MHE used. The following table summarises the footprint required for the bulk storage area for each variant. The total pallet spaces required to achieve the target number of pallets is also shown:
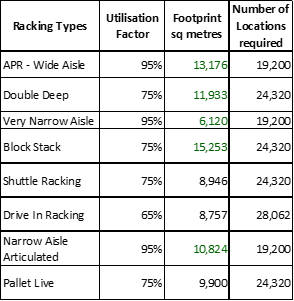
Rack Type – Storage Space Comparison
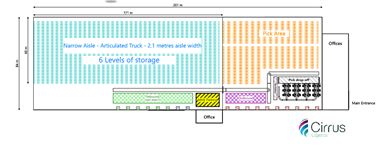
Example Layout – Narrow Aisle Articulated APR - 10,824 sq. metres
Example Layout VNA - 6120 sq. metres
Exercise Results
For each of the 8 alternatives the simulation was run and in each case the results were totally different. The put away and pick rates were different, the number of employees and trucks required to meet the outputs were different. The travel distances varied considerably.
The outputs were populated into a cost model, and comparisons between concepts quickly identified different
labour costs
MHE costs
space costs (Rent plus Rates, Utilities, Maintenance etc).
The cost to install each rack type could also be compared and using this information.
The purpose for sharing this story is that the exercise based upon some high-level assumptions, using a fictitious warehouse, generated some really interesting results. The time required to compare one concept to another was very quick.
Tagged as: Warehouse design, Warehouse operations
Share this post: