Warehouse Design – Setting KPIs
Posted on 26th July 2022
In my series of Blogs, we have looked at various aspects of warehouse design.
In this Blog we will look at how an Industrial Engineer, or Lean Practitioner, would set KPI’s using work measurement techniques including Time and Motion Studies, or using synthetic tools such as MOST or MTM.
We will also discuss how operating methods are analysed and the documentation and tools used to compare a current operation to a modified operation.
I would suggest that having accurate productivity rates is vital in order to have accurate planning and forecasting, controlling, measuring operational costs, and for performance measuring.
This is a detailed and complex subject, but please persevere, the purpose of this Blog is to provide a high-level overview of the process. The work measurement tasks should only be performed by qualified engineers / practitioners.
Setting KPIs
KPI’s can be based upon historic rates achieved over time, or they can be set using work study techniques set by qualified engineers. Historic rates will not be as accurate or valid as an engineered rate and may not be a true reflection of the actual work content. Over time operating methods, layouts, equipment, and other variables associated with operations may change, and this may go unidentified.
Work Study is a generic term used by engineers to perform two distinct tasks:
Method Study – method analysis / study of the processes to perform work
Work Measurement – recording the time taken to perform the work.
The work measurement process can take the form of either:
a “Time and Motion” study conducted with the aid of a stopwatch
Activity sampling – this technique is not commonly used, and the results are less accurate – activity sampling is not covered in this Blog
using a pre-determined time system, such as MOST or MTM2.
TH Comment: as a qualified Industrial Engineer I can provide Work Measurement support, or I can advise the most suitable way to move forward for a large-scale operation.
Method Study Analysis
Method study is a technique to reduce overall work content by eliminating the unnecessary movements of workers, materials, or equipment. In this Blog we will review two of the most commonly applied techniques – Flow Process Charts and Value Stream Mapping.
Method study definition:
Method Study is a critical questioning technique - “The systematic recording and critical examination of the factors and resources involved in existing and proposed ways of doing work, as a means of developing and applying easier and more effective methods and reducing costs.” The approach incorporates the questions:
What?
Where?
When?
Who?
How?
Why?
A detailed method study will typically include some form of charting and documenting of processes both current and proposed, using some or all of the following techniques:
Flow Process Charts
Flow Diagrams
Material / Labour Process Charts
Material / Labour Process Charts – overlayed on a layout – depicting movements between stages
Value Stream Mapping
Various other charts – as required.
Process Charts
A Process chart is used to record the current and future way that a task is completed. The engineer will record the key elements of work and create an accurate description of the process categorising each individual task as follows:
Operation: a main step, where the part, material or product is usually modified or changed
Inspection: indicates a check for quality or quantity
Transport: the movement of workers, materials or equipment
Storage: controlled storage in which material is received into or issued from a store, or an item is retained for reference purposes
Delay or Temporary Storage: indicates a delay in the process, or an object laid aside until required.
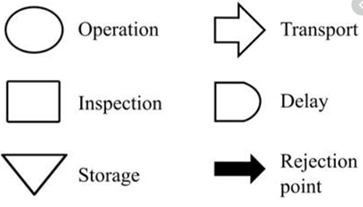
American Society of Mechanical Engineers (ASME) symbols
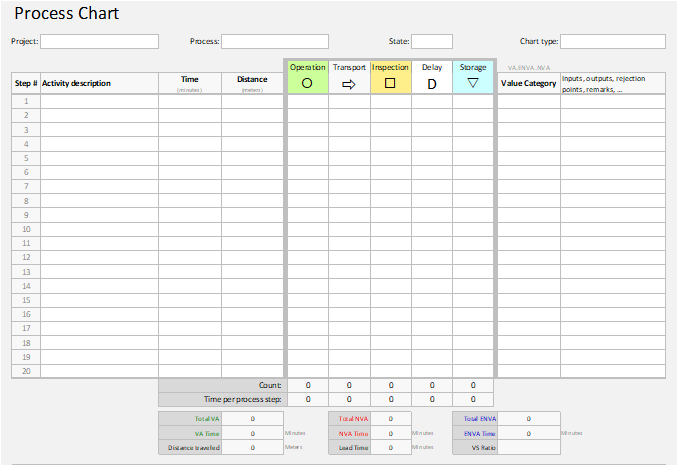
Example: Blank Process Chart
Process Chart Guidelines
A Process Chart is a table illustrating the sequence of actions within a process.
1st: List all activities within the process
2nd: Identify the type of activities (operation, transport, inspection, delay, or storage). Use only the character "X" under the symbols to identify the type of activity
3rd: Classify each activity into value added, non-value added, or essential non-value added
4th: record time and distance associated with each element of work.
The next stage is to review if the non-value add items can be eliminated by some form of redesigning the operation. Also, could the operating movements be reduced by making changes to the layout?
Value Stream Mapping
The Value stream mapping process allows you to create a detailed visualisation of the flow of materials and information, and categorises activities into three segments: value enabling, value adding and non value adding. As with Process Charts, the main objective is to identify and eliminate non value adding activities in each step, and to reduce the wait time between steps wherever possible.
Value-stream mapping is a lean-management method for analysing the current state and designing a future state for a series of events, that take a product or service, from the beginning of the specific process until it reaches the customer.
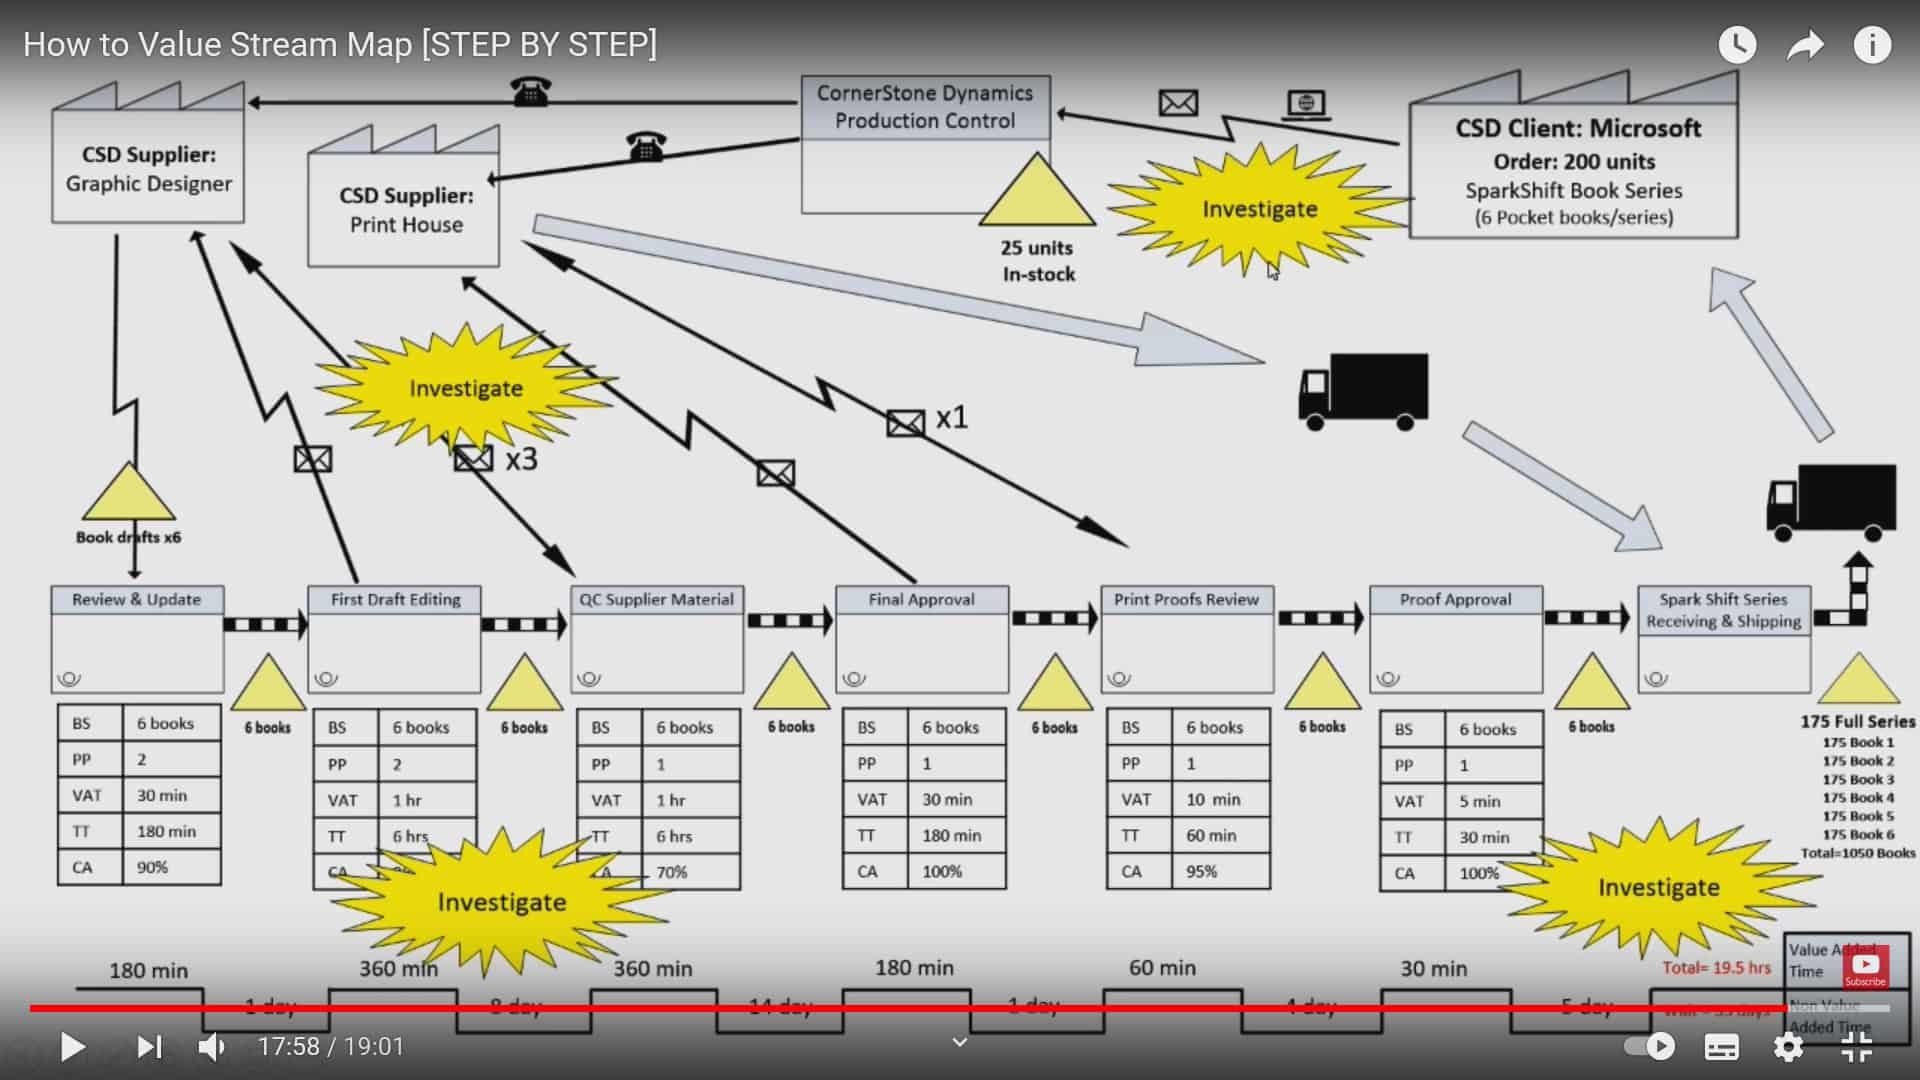
Value Stream Mapping
Time and Motion - Work Measurement / Stopwatch Time Studies
Time and Motion Definition
Time and Motion study is the application of techniques designed to establish the time for a qualified worker to carry out a specified job at a defined level of performance. The time to perform a task is adjusted based on the effort or pace of the operator. In addition to the time to perform an operation allowances are added to cover unavoidable delays, rest to overcome fatigue, and personal needs.
Note: a qualified worker is someone who is trained and competent at performing the task to be timed.
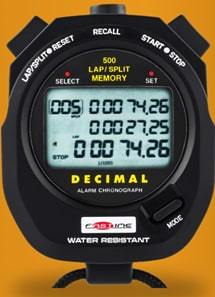
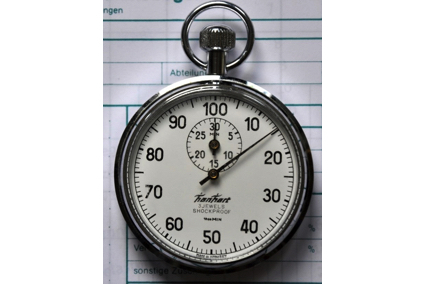
Fastime Digital Deciminute Stopwatch
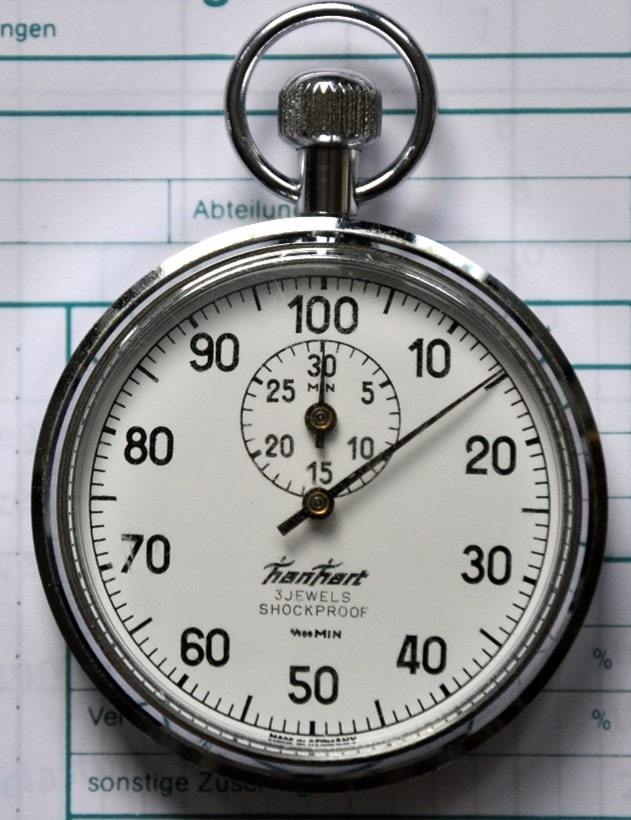
Note: the sharp eyed amongst you would have noted that the stopwatch on page 1 is a Deciminute watch, and 1 full revolution is 1 minute, half a revolution = 50 which is actually 0.5 minutes (30 seconds). For planning and reporting purposes standard times are usually reported in Deciminutes. Therefore, if a time for a task is reported as 0.6 minutes, this is equal to .6 x 60 = 36 secs.
TH Comment: analogue Deciminute watches are likely to become collectors’ items, digital watches are more practical to use and easier to read and are the preferred watch for most engineers. The watch I use is a Fastime 500DM (Decimal minute stopwatch for work study).
The standard time to complete a task will also need additional allowances to allow for:
Fatigue – an allowance that considers the physical exertion required to perform the task – heavy lifting will incur a higher allowance
Contingency – an allowance added to a task for delays to the operator outsider their control, e.g., waiting for a pick face to be replenished – or waiting for a truck to move out of an aisle
Relaxation/ Personal needs – usually calculated as a % of the day used to cover paid breaks (e.g., tea breaks)
The process starts with the engineer observing the operation and breaking the overall operation into elements of work, each will have a definite start and end to each task, e.g., picking up a tool (the start), completing a task and putting the tool aside (the end). The engineer will complete a sheet similar to the example below: for each element of work the engineer will record the elapsed time and record a performance rating.
Typically, an engineer may record 10 cycles of an operation, this will vary depending on the overall cycle time of the task being studied, a short highly repetitive task may be recorded over more cycles.
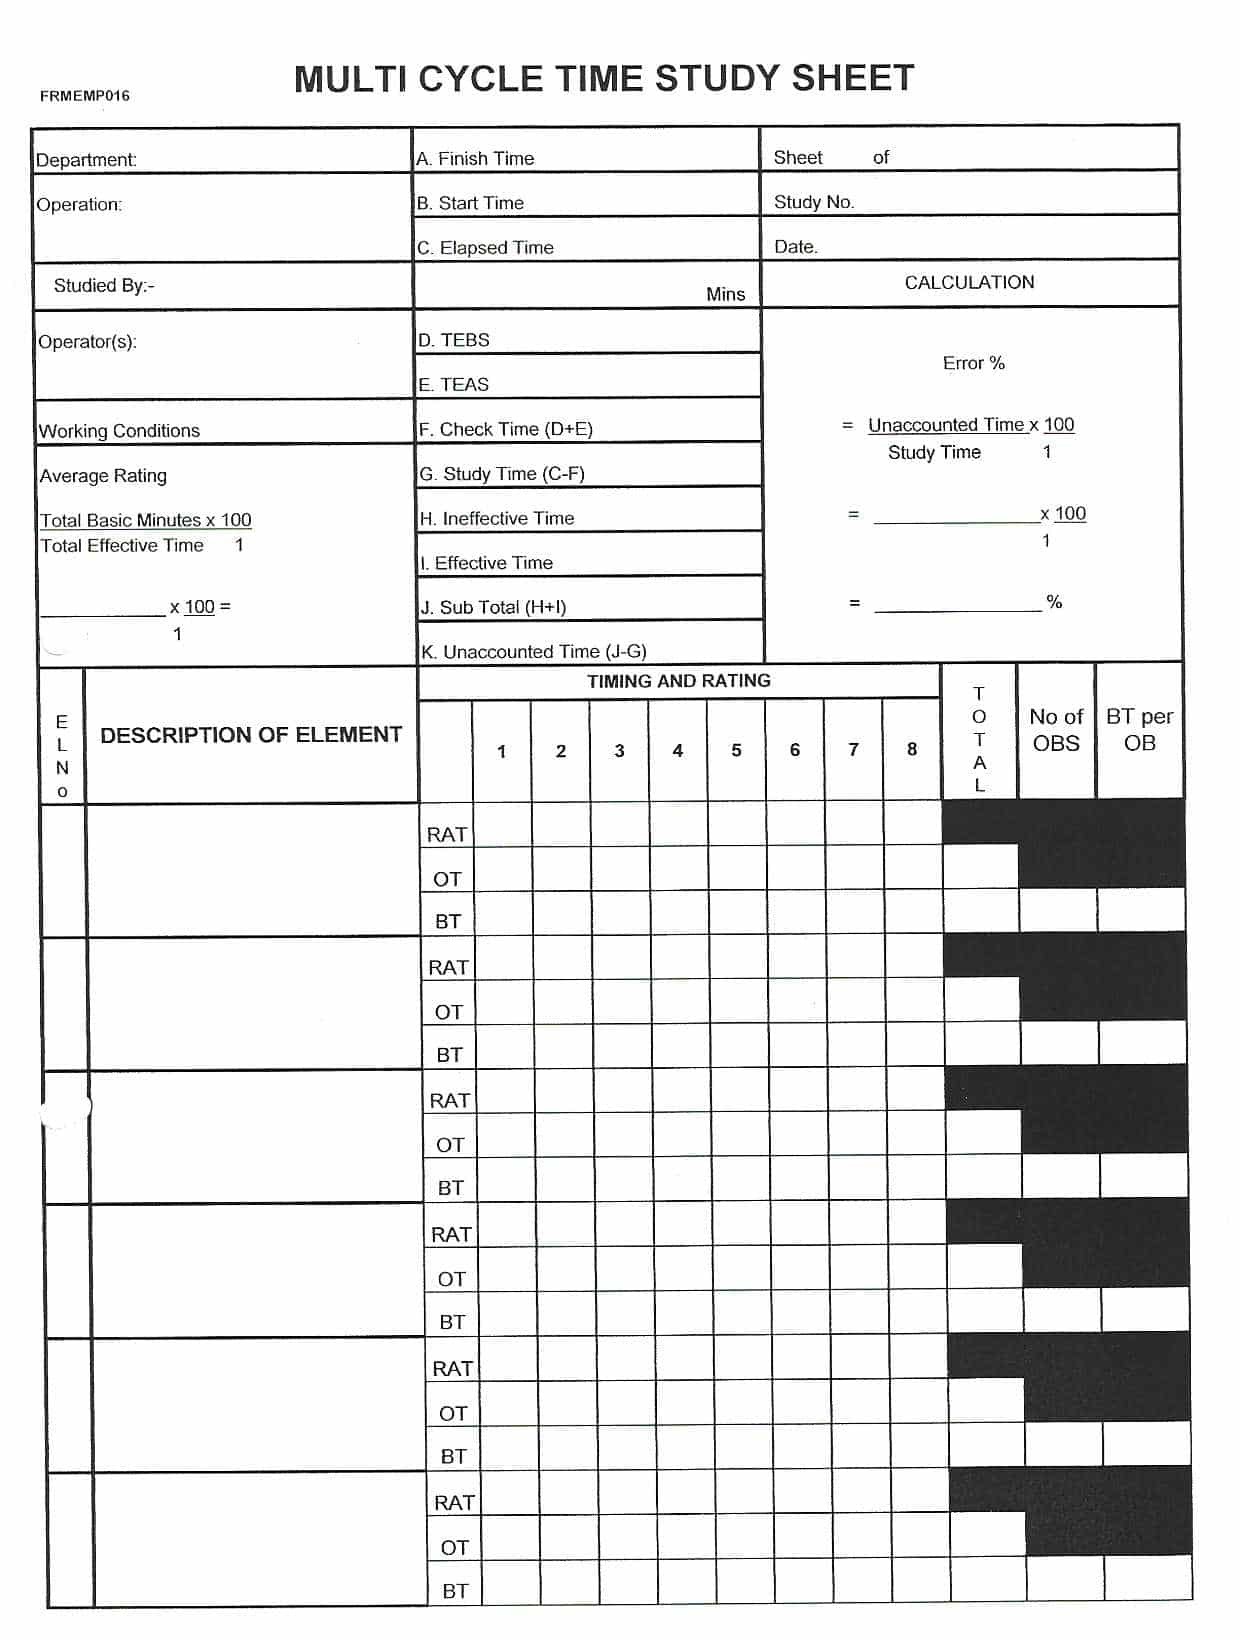
Time and Motion Observation sheet
Effort Rating Definition
An engineer conducting the time study will record a perceived effort rating for each element of work recorded. The rating is based on a scale equivalent to an operator walking at an equivalent pace of 4mph, this is rated as 100% performance. The engineer would record this as 100 during a time and motion study. The engineer will apply ratings in 5% increments – so typically performance will be recorded as 80, 85, 90, up to 120, although levels in excess of 110 are not usually observed during a time and motion study.
Standard Performance (100%) Definition
The rate of output which qualified workers will naturally achieve without over-exertion as an average over the working day or shift provided, they adhere to the specified method and provided that they are motivated to apply themselves to their work.
As an example: if an operator takes 3minutes to perform a task at a perceived effort level of 100% then the time allocated to the task is 3 minutes. If the operator were to then perform the task in 4 minutes, at a perceived effort of say 75%, then in this instance the calculated time would be 4 minutes x 75% = 3 minutes. This time is known as the normalised time (the time to perform a task at 100% effort after the recorded time and perceived effort have been considered).
On top of the normalised time the Fatigue, Contingency and Relaxation Allowances are added to get a Standard time. Therefore, if our time to perform a task is 3.00 minutes, this could become 3.25 minutes once we allocated the allowances. This is the time that should be used for KPI reporting and costing of work.
MOST Work Measurement System
What is MOST?
MOST (Maynard Operation Sequence Technique) is a “predetermined motion time system” based upon the application of synthetic data (or standard data) to determine how long it takes to perform a sequence of tasks in an activity. A work task is broken down into small work elements, for each element a sequence of events is created, and variables are applied for distance or weights or quantities.
Advantages of using MOST:
Quick and economical to apply
Allows for quick comparison of alternative methods
Allows for comparison of alternative layouts and the operational methods.
The MOST model is created by breaking activities into method steps or work elements, the work content for each element is calculated using sequence models (one sequence model is applied to each element). Most models are quick to create and easy to modify.
The sequence steps each have a frequency applied to produce an overall time for a task.
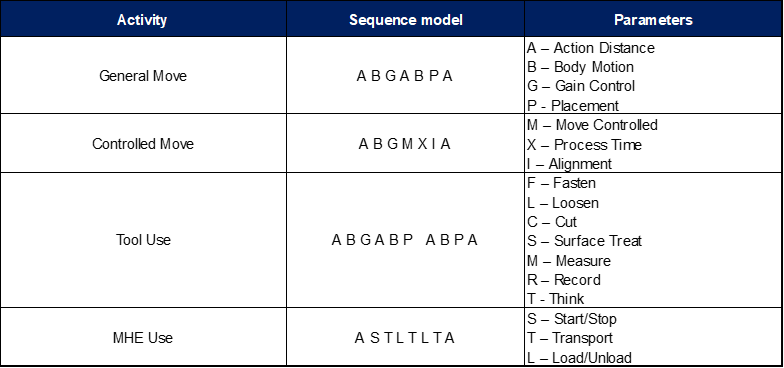
Sequence Models Used in MOST
For each element of work, you can then calculate a standard time to perform the task. Although this sounds complicated, with the appropriate training the process is a quick and easy way of generating highly accurate times for tasks.
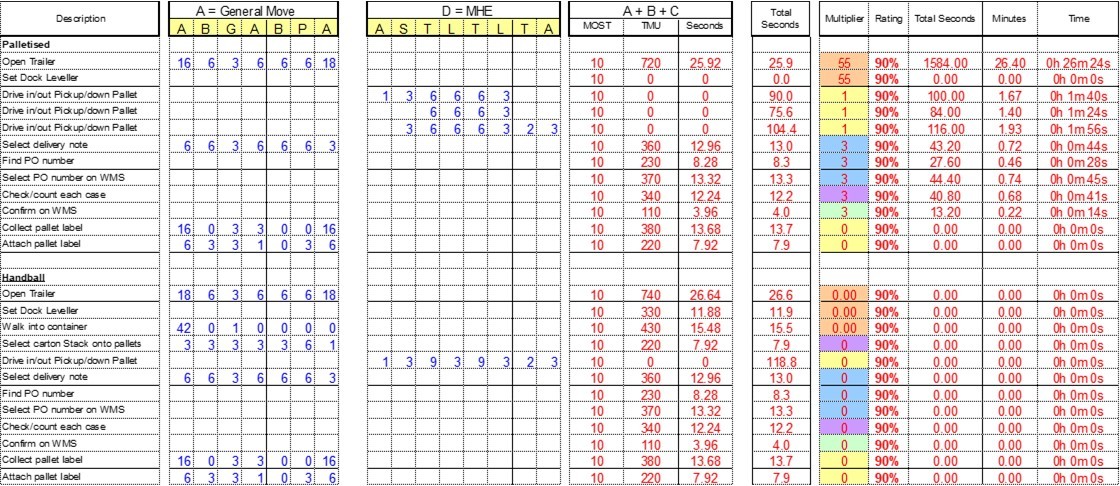
Example MOST Analysis – Unloading a trailer
As an example, the time to calculate the time to unload a vehicle could be less than two hours if the engineer is using MOST. A time and motion study would take many hours to complete.
Once a MOST model has been created it is simple to make changes based upon new operating assumptions or changing travel distances in the event of modifying a layout.
As with Time and Motion techniques, MOST will generate a normalised time to complete the task, and in the same way additional allowances will be added for Fatigue, Contingency and Relaxation Allowances are added to get an overall Standard time.
TH Comment: I have over time generated an Excel based template that I use for all warehouse tasks. This allows me to very quickly calculate the times to perform all tasks in the warehouse by simply populating the model with the variables appropriate to the operation.
MTM2
MTM Definition
Methods - Time Measurement (MTM) is a predetermined motion time system that is used primarily in industrial settings to analyse the methods used to perform any manual operation or task and, as a product of that analysis, set the standard time in which a worker should complete that task. There are multiple versions of MTM, the 2nd generation - MTM2, and MTM3 are the most commonly applied.
MTM is a similar concept to MOST, the operation is documented away from the shop floor and variables are applied to MTM models and the overall time for an operation can be generated.
MTM2 is a more detailed and a more accurate method of generating results than MOST. It is more suitable for highly repetitive tasks with a quick cycle time, and suitable for tasks that are repeated frequently. When using MTM2 the process to generate time standards is longer than when compared to MOST, however, it is ideal for tasks such as Goods to Man picking operations, where the operator may be expected to pick in excess of 200 lines / hour, the process repeated daily, and possibly by many operators over numerous shifts. MOST can also be used to generate accurate results for these types of operations, however, the use of MTM2 would be more accurate.
MTM3 is similar to MOST in terms of it being a quick to apply system that will generate results at a similar accuracy level to MOST.
TH Comment: I am not qualified to apply MTM, however, please let me know if you need assistance.
How do we calculate KPI Performance?
Typically, performance reporting is at an individual operator, or for a team, or for an overall site. Performance is generally measured as a percentage of a target, with the target being 100% performance.
So, if we have calculated that an operator should pick at 120 units / hour, this is equal to 100% performance. This is known as Standard Performance.
KPI Performance Calculation Example
A KPI for case picking is set as a rate of 120 cases per hour (0.5 minutes or 30 seconds per case). If an operator is picking 120 cases per hour, then this is expressed as 100% performance (standard Performance). If another operator is picking at 80 cases per hour then this is 66.7% performance, and so on.
If operators are picking at an average of 180 cases per hour (150% performance), this would suggest that the KPI needs to be reviewed, maybe the pick profile has changed, or the travel distances have changed and the KPI may need to be modified.
TH Comment: typically for estimating and planning purposes a rate of 85% is generally considered appropriate.
Conclusion
All businesses are looking to improve their operating efficiencies. The process of evaluating operating methods, eliminating nonvalue adding tasks and the setting of engineered time standard provides management with accurate rates that can be used for planning, performance measuring and also for calculating costs. Any future investments in new methods, equipment or automation that are expected to be more efficient, can then be compared against current methods and productivity rates, and investments can be made based on accurate information and informed decisions can be made.
If you are considering setting KPI’s, or maybe investing in automation, the assessment of alternative concepts should be made by impartial, independent experts. If I can help you with modelling or simulation, or any other aspect of warehouse operations design, please do not hesitate to ask for any advice. I would of course be delighted to provide a quotation to provide any assistance required.
Share this post: